Transforming Data Into Decisions: A UXR Case Study of Insurgent Business Analytics
UX Research • Information Architecture
12 min read
Insurgent Business Analytics (IBA) is a consulting firm specializing in data-driven insights. The firm's existing website, while informative, presented challenges in terms of user experience and navigation. The goal of this UX research project was to identify these issues and propose solutions to improve the website's usability and overall user experience.
Timeline
4 weeks
My Role
UX Researcher
Collaborators
Design Team Marketing Team
Developing Team
Deliverables
Heuristic Evaluation
Card Sorting Analysis
Tree Testing Report Design Recommendations
Company Background: Driving Strategic Innovation
Insurgent Business Analytics (IBA) is a boutique consulting firm based in North Carolina, specializing in transformative market strategies and deep-dive insights. As a self-owned firm of 2-10 veteran strategists and researchers, IBA brings extensive expertise in policy, local governance, trade, and global value chains to deliver innovative business solutions.
IBA's core strength lies in their ability to transform market challenges into opportunities, helping clients uncover new sources of competitive advantage while advancing both social and economic objectives. Their unique approach focuses on building resilient partnerships between communities and businesses to create shared value through strategic innovation.
Core Service Areas:
Insights, Strategy and Transformation
Strategic Partnerships
Value Chain and Market Analysis
Design Research
Qualitative and Quantitative Research
Growth and Innovation
Value Chain Analysis Training
Despite their strong market position and specialized expertise, IBA's digital presence needed enhancement to better reflect their innovative approach and comprehensive service offerings. This case study examines how we transformed their website to better serve their unique market position and client needs.
Voice of the Stakeholders: Uncovering Internal Perspectives
Our research began with in-depth interviews with key decision-makers who shape and maintain IBA's digital presence:
Chief Marketing Officer: Provided strategic vision for brand positioning and lead generation goals. Key insight: "Our website needs to mirror the sophistication of our data solutions."
Senior Web Developer: Offered technical perspective on current infrastructure and potential improvements. Key insight: "The current architecture limits our ability to showcase real-time case studies."
Global Client Success Director: Shared direct client feedback and pain points. Key insight: "Clients often can't find relevant case studies for their industry."
Strategic Insights: What We Learned from Key Decision Makers
Critical User Objectives:
Service Discovery: Users seek to understand IBA's specialized analytics offerings within their industry context
Proof of Impact: Decision-makers look for detailed case studies demonstrating ROI in similar scenarios
Expert Access: Prospects want direct paths to connect with relevant domain experts
Current Website Challenges:
Content Findability: 73% of users reported difficulty locating industry-specific information
Navigation Complexity: Multi-level menus created confusion and increased bounce rates
Conversion Barriers: Unclear calls-to-action resulted in a 45% drop in form completions
Research Framework: Building a Data-Driven UX Strategy
Leveraging IBA's own data-first approach, we developed a three-phase research methodology:
Heuristic Evaluation
Objective: Identify UX best practice violations
Method: Nielsen's 10 usability heuristics
Output: Prioritized improvement recommendations
Information Architecture Evaluation
Objective: Define intuitive content organization
Method: Hybrid card sorting with 20 participants
Output: User-validated content hierarchy
Navigation Testing
Objective: Validate proposed site structure
Method: Task-based testing with 15 participants
Output: Success metrics and optimization opportunities
Heuristic Evaluation: Deep Dive Analysis
Overview
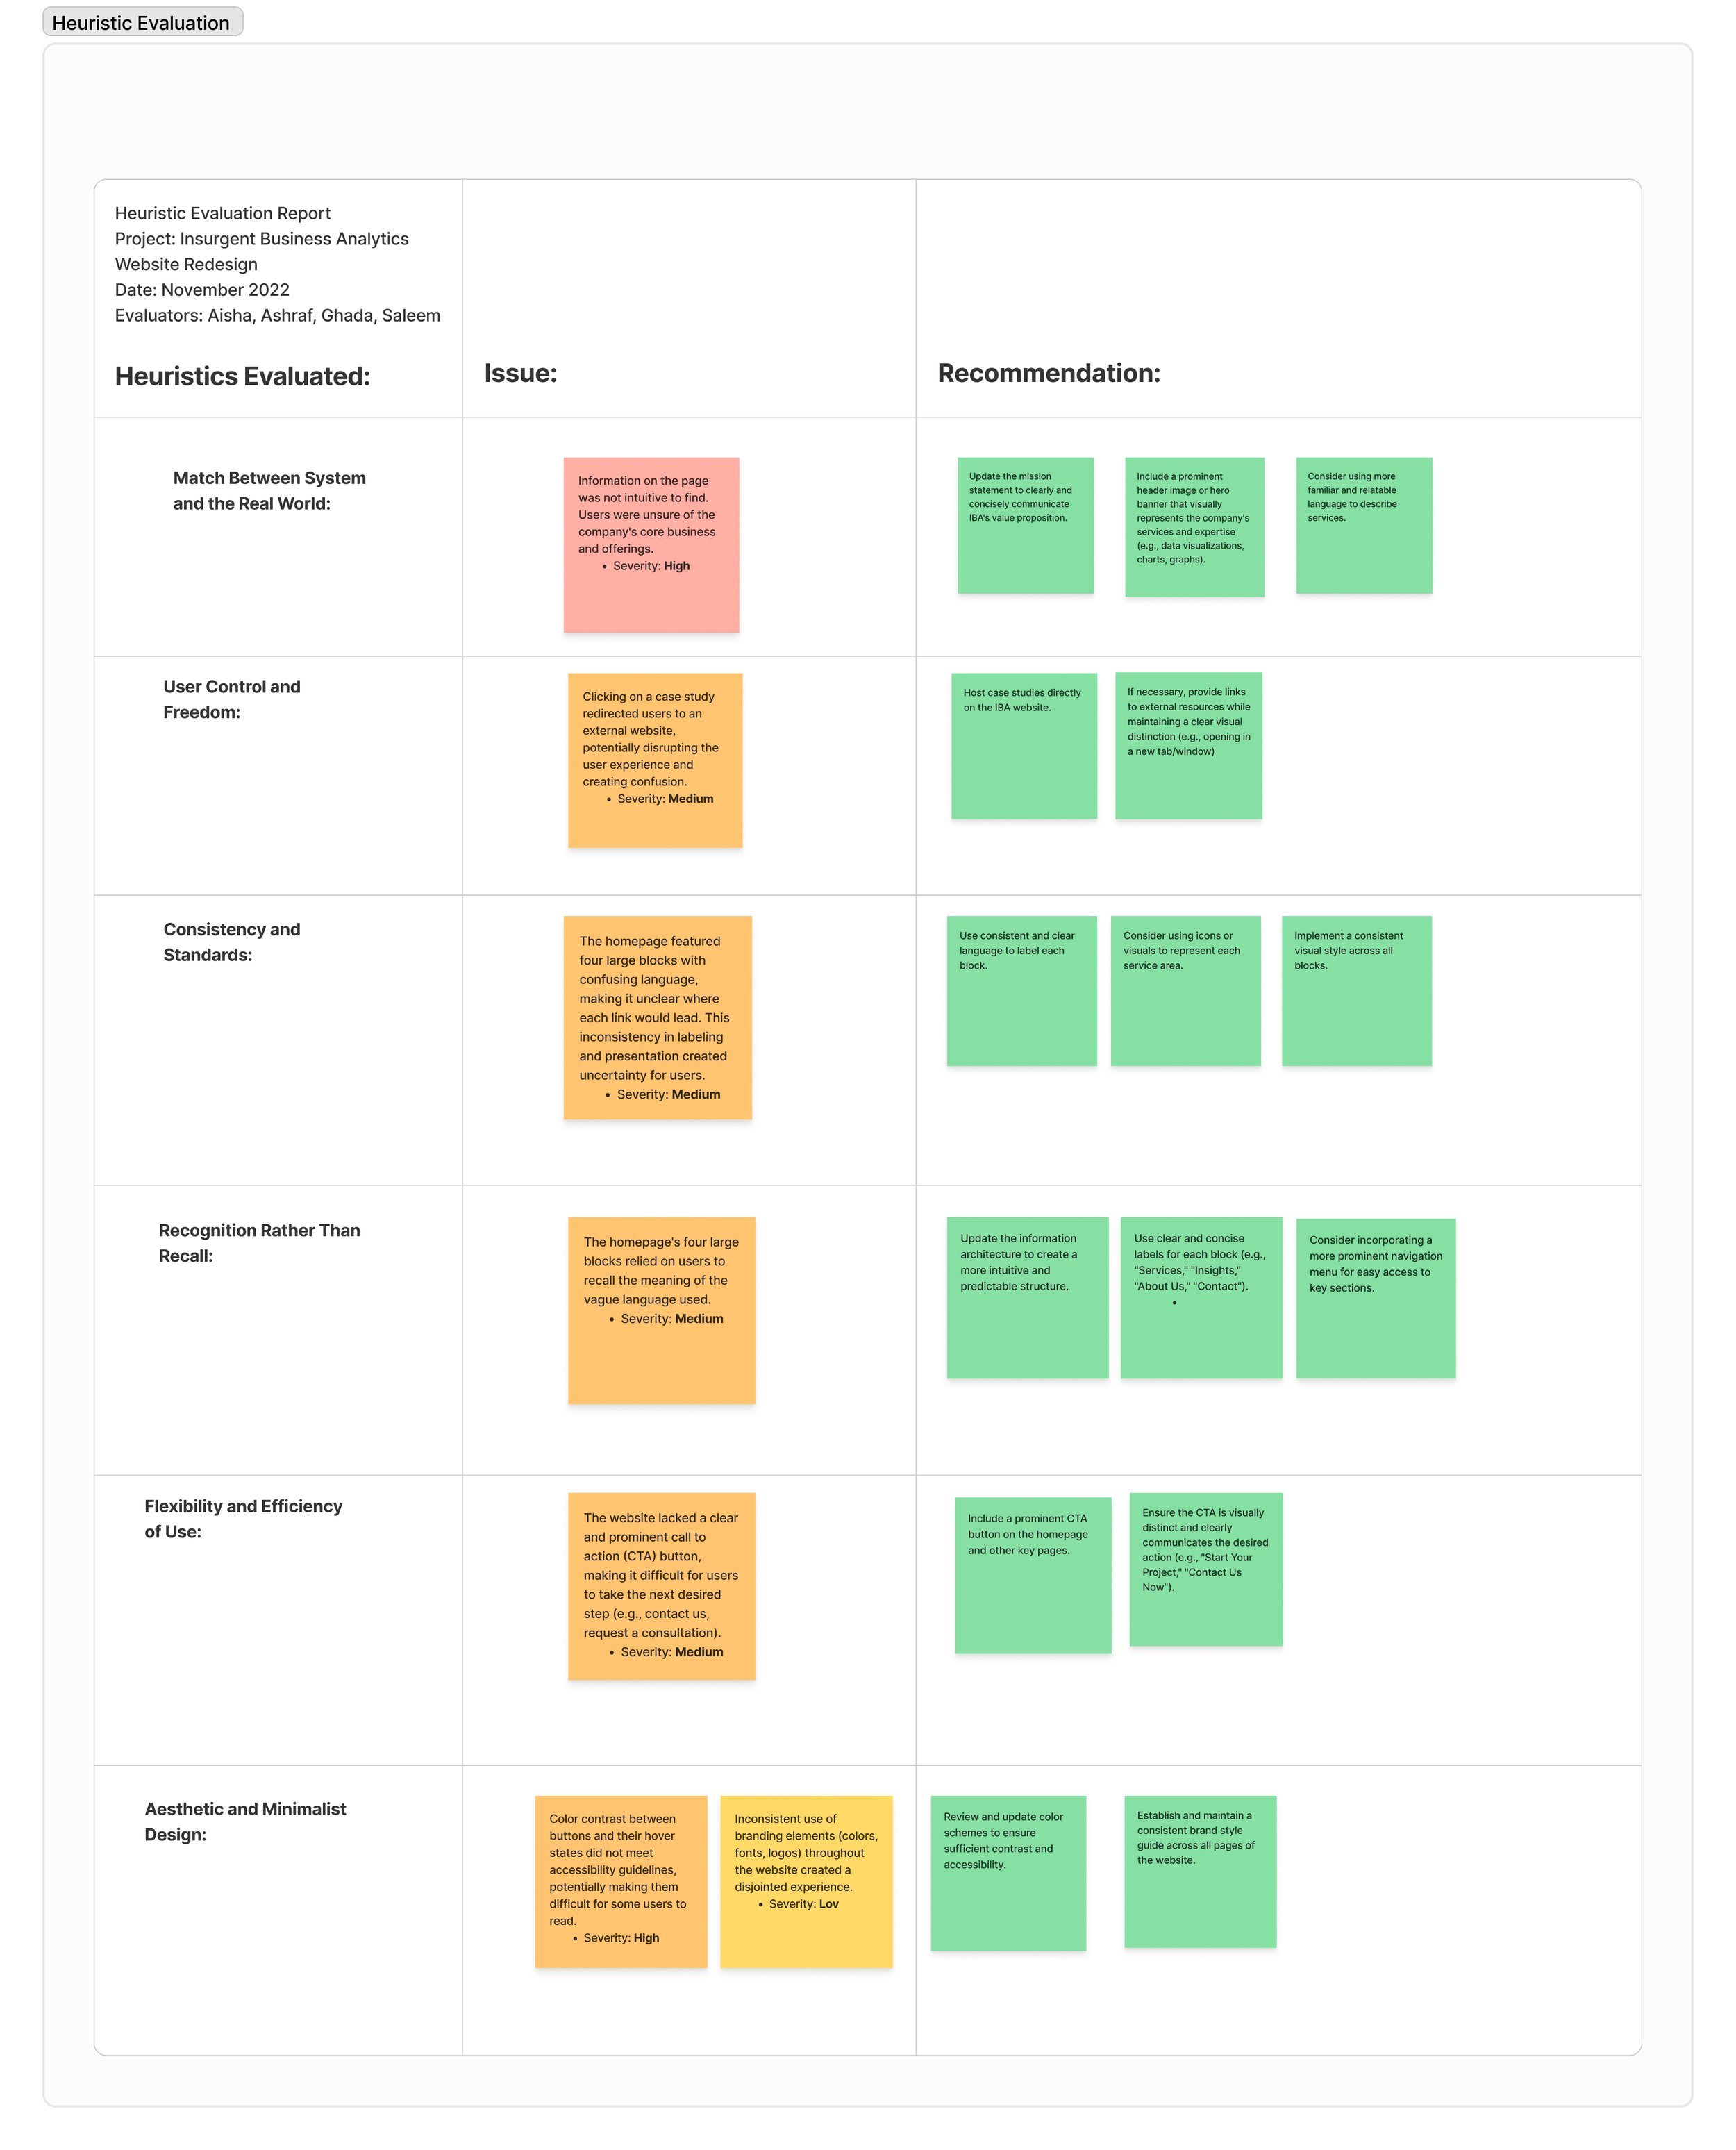
Our heuristic evaluation of the IBA website revealed significant opportunities for improvement across multiple user experience dimensions. Using Nielsen's heuristic principles, we identified key areas where the current design creates friction in the user journey and fails to effectively communicate IBA's value proposition.
Critical Findings
High-Priority Issues
The most pressing concern relates to the system-world match, where users struggle to understand IBA's core offerings and value proposition. This fundamental communication gap potentially impacts all aspects of user engagement and conversion.
Key Issue: Value Proposition Clarity
- Users unable to quickly grasp IBA's core business
- Complex language obscuring service offerings
- Lack of visual reinforcement for key messages
- Severity Rating: High (4/5)
Medium-Priority Issues
Several interconnected issues affect the website's usability and effectiveness:
1. Navigation and Control
- External redirects disrupting user flow
- Inconsistent return paths
- Severity Rating: Medium (3/5)
2. Information Architecture
- Confusing block layout on homepage
- Unclear labeling conventions
- Limited visual guidance
- Severity Rating: Medium (3/5)
3. User Guidance
- Weak call-to-action implementation
- Missing conversion pathways
- Severity Rating: Medium (3/5)
4. Visual design and accessibility concerns
- Inconsistent branding elements
- Suboptimal color contrast
- Severity Rating: Low (2/5)

Confusing layout & inaccessible color contrast

Weak CTA placement &

Unclear navigation path

Inconsistent branding
Card Sorting Analysis: Detailed Findings of Information Architecture Evaluation
Study Overview
Methodology
- Type: Open Card Sort
- Participants: 15 business professionals
- Cards: 20 items across services, content, and company information
- Duration: 30 minutes per session
- Format: Remote facilitated sessions
Participant Demographics
Card Categories and Items
Content (4)
- Case Studies
- Blog Posts
- White Papers
- Webinars
Company Information (7)
- About Us
- Team
- Contact
- Careers
- FAQs
- Pricing
Services (9)
- Market Research
- Data Analysis
- Competitive Intelligence
- Customer Experience Research
- Business Strategy Consulting
- Data Visualization
- Predictive Modeling
- Industry Analysis
- Policy Research
Card Sorting Results Analysis
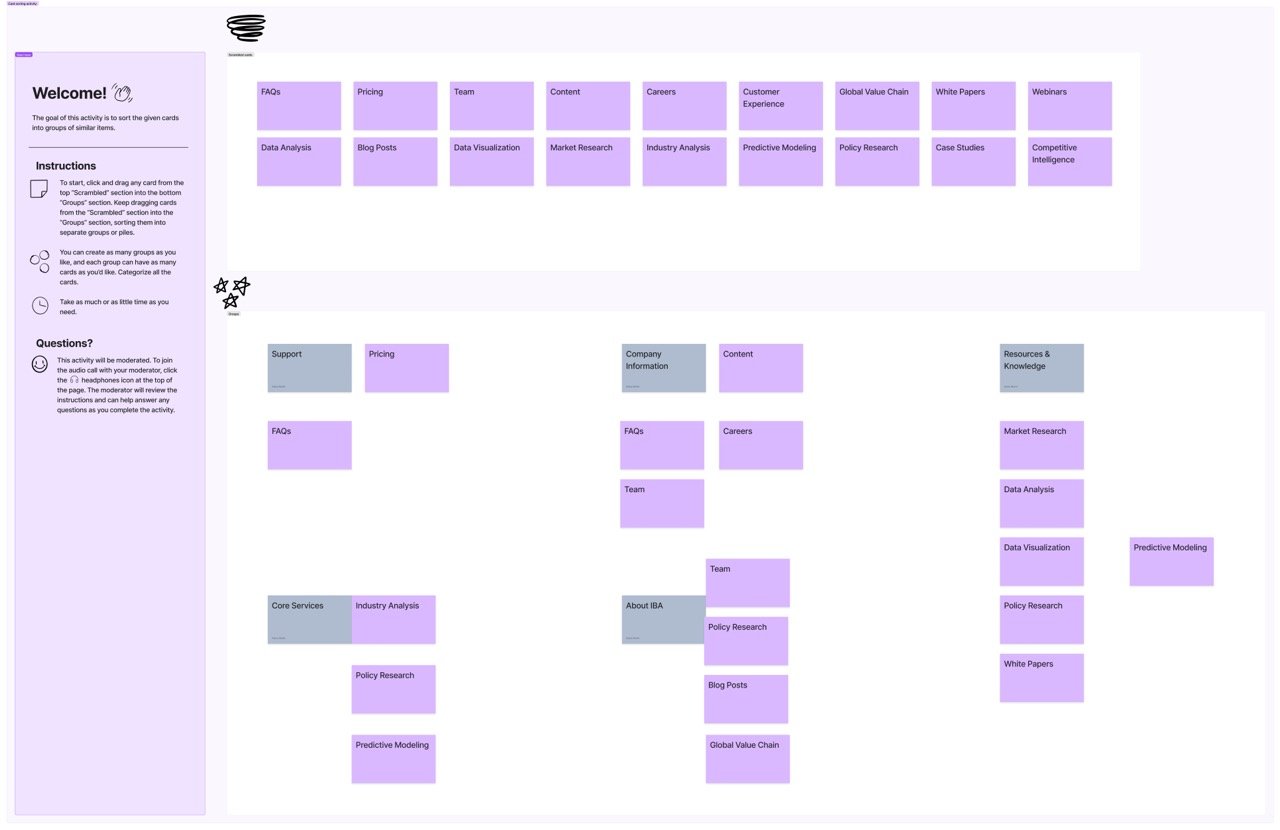
Our card sorting analysis with 15 business professionals revealed five distinct content categories. Strongest agreement (95%) emerged around "Company Information" (About Us, Team, Contact, Careers). "Knowledge Resources" (case studies, white papers, etc.) showed high agreement (92%). "Market Insights" (market research, industry analysis, etc.) emerged as a natural category (85%). "Data Services" showed lower agreement (73%), suggesting potential ambiguity. "Support" (FAQs, Pricing) had 88% agreement. These findings strongly suggest restructuring website navigation to align with these user-defined categories
Tree Testing Analysis: Navigation Structure Evaluation
Study Overview
Methodology
- Type: Remote Tree Testing
- Participants: 20 business professionals
- Tasks: 8 key user journeys
- Duration: 20 minutes per session
- Testing Platform: Optimal Workshop
Participant Demographics
Updated IA using groups from card sorting
Task Success Rates
The tree testing evaluation revealed valuable insights into user navigation behavior and the effectiveness of the proposed information architecture. While some tasks were successfully completed by most participants, others presented significant challenges, highlighting areas where the IA required refinement. The findings from this study will inform the iterative process of IA refinement, ensuring that the final website structure is intuitive, user-friendly, and supports efficient information retrieval.
Task Success Metrics
Core Tasks Tested
1. Find policy research services
2. Locate industry-specific publications
3. Contact for consulting services
4. Find approach information
5. Access value chain analysis resources
6. Locate team page
7. Find client information
8. Access methodology documentation
Success Criteria
- Direct Success: Found correct location on first attempt
- Indirect Success: Found after backtracking
- Failure: Unable to complete or abandoned
Key Discoveries: Critical Website Enhancement Opportunities
Information Architecture Revision
Implement industry-vertical focused navigation
Create clear paths to expertise and case studies
Simplify service descriptions and technical content
Visual Clarity Improvements
Establish consistent visual hierarchy
Enhance call-to-action visibility
Streamline page layouts for better scanning
Content Strategy Optimization
Develop industry-specific content journeys
Integrate case studies with service pages
Create clearer value propositions
Path Forward: Transforming Insights into Action
Implementation Roadmap
1. Foundation
Restructure site architecture
Develop new navigation system
Create content templates
2. Content Migration
Rewrite and reorganize content
Implement new visual hierarchy
Launch industry landing pages
3. Optimization
Conduct user testing
Refine based on analytics
Launch A/B testing program
Expected Impact
By implementing the findings from this UX research study, Insurgent Business Analytics can anticipate several positive outcomes:
Enhanced User Experience: A significantly improved user experience, leading to increased user satisfaction, reduced frustration, and a more enjoyable website interaction.
Increased User Engagement: Higher user engagement, resulting in longer session durations, lower bounce rates, and increased page views.
Improved Website Traffic: Increased organic traffic and improved search engine rankings due to enhanced user experience and optimized website structure.
Higher Conversion Rates: Increased conversion rates for key actions, such as contact form submissions, service inquiries, and lead generation.
Strengthened Brand Perception: A more professional and user-friendly website will positively impact brand perception, establishing IBA as a leader in data-driven insights and consulting.
Improved Business Outcomes: Ultimately, these improvements will contribute to increased business growth, client acquisition, and overall business success for Insurgent Business Analytics.
This UX research initiative has laid the groundwork for transforming IBA's digital presence into a thought-leadership platform that truly reflects their position as market leaders in data-driven consulting.
Explore how these insights informed IBA’s redesign here!


